
Recruiting Funnel Quality helps you compare whether candidate sources are contributing useful pipeline movement and Hired outcomes, not only candidate volume.
Generate the Report
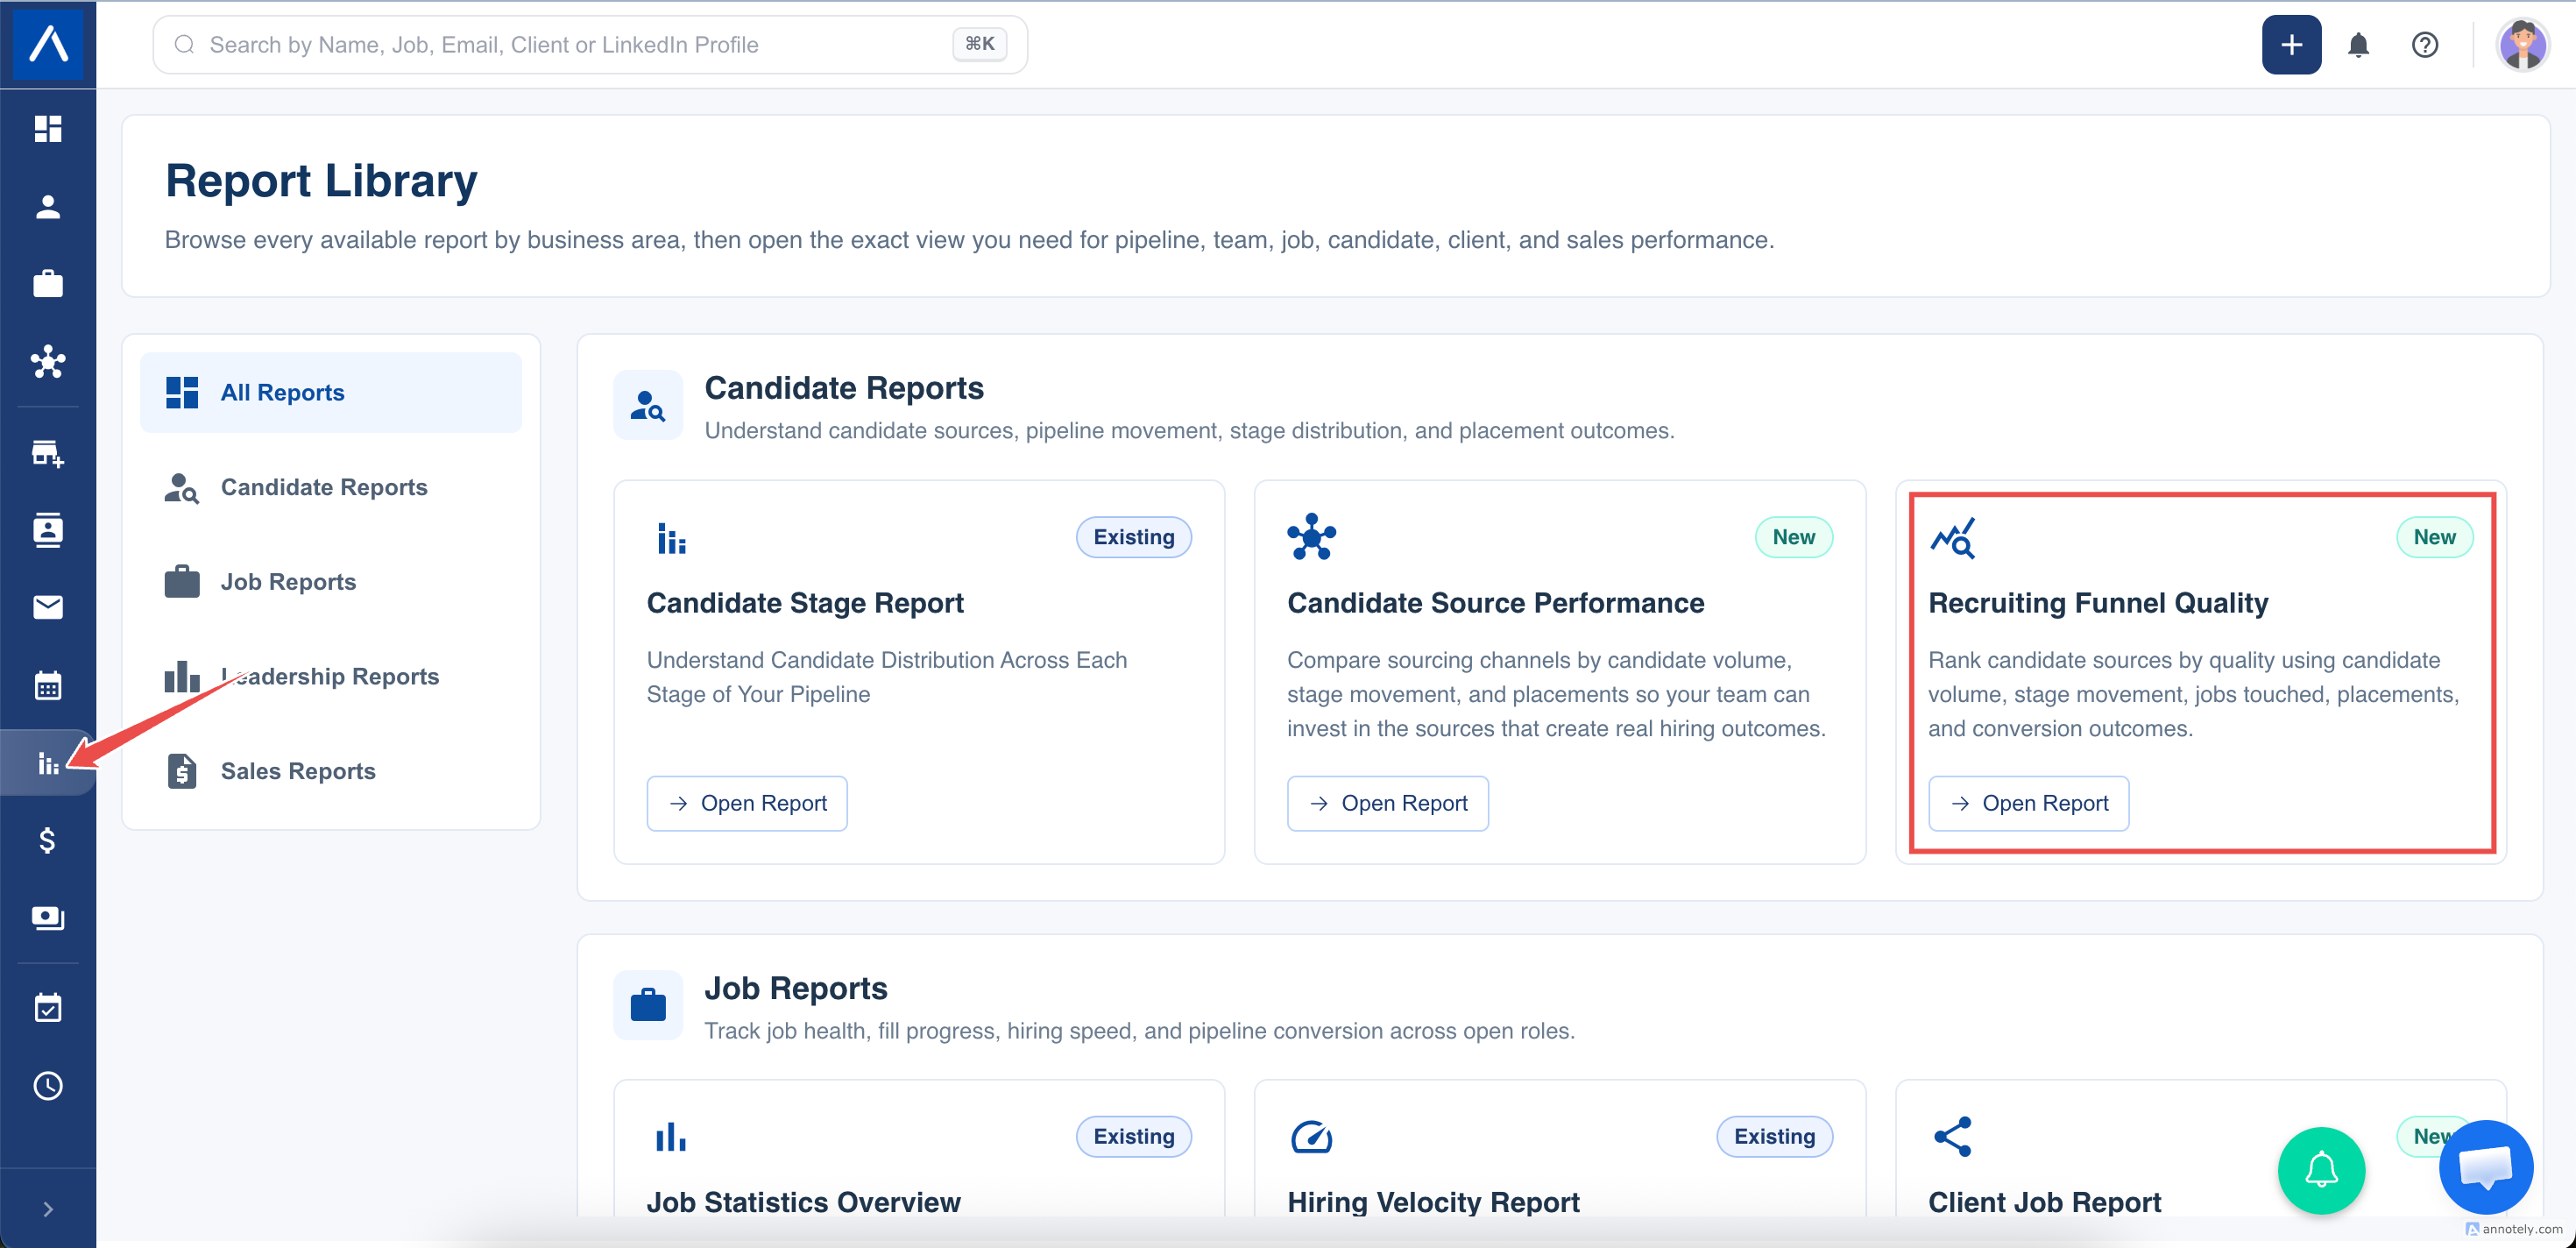
- Open Reports > Recruiting Funnel Quality.
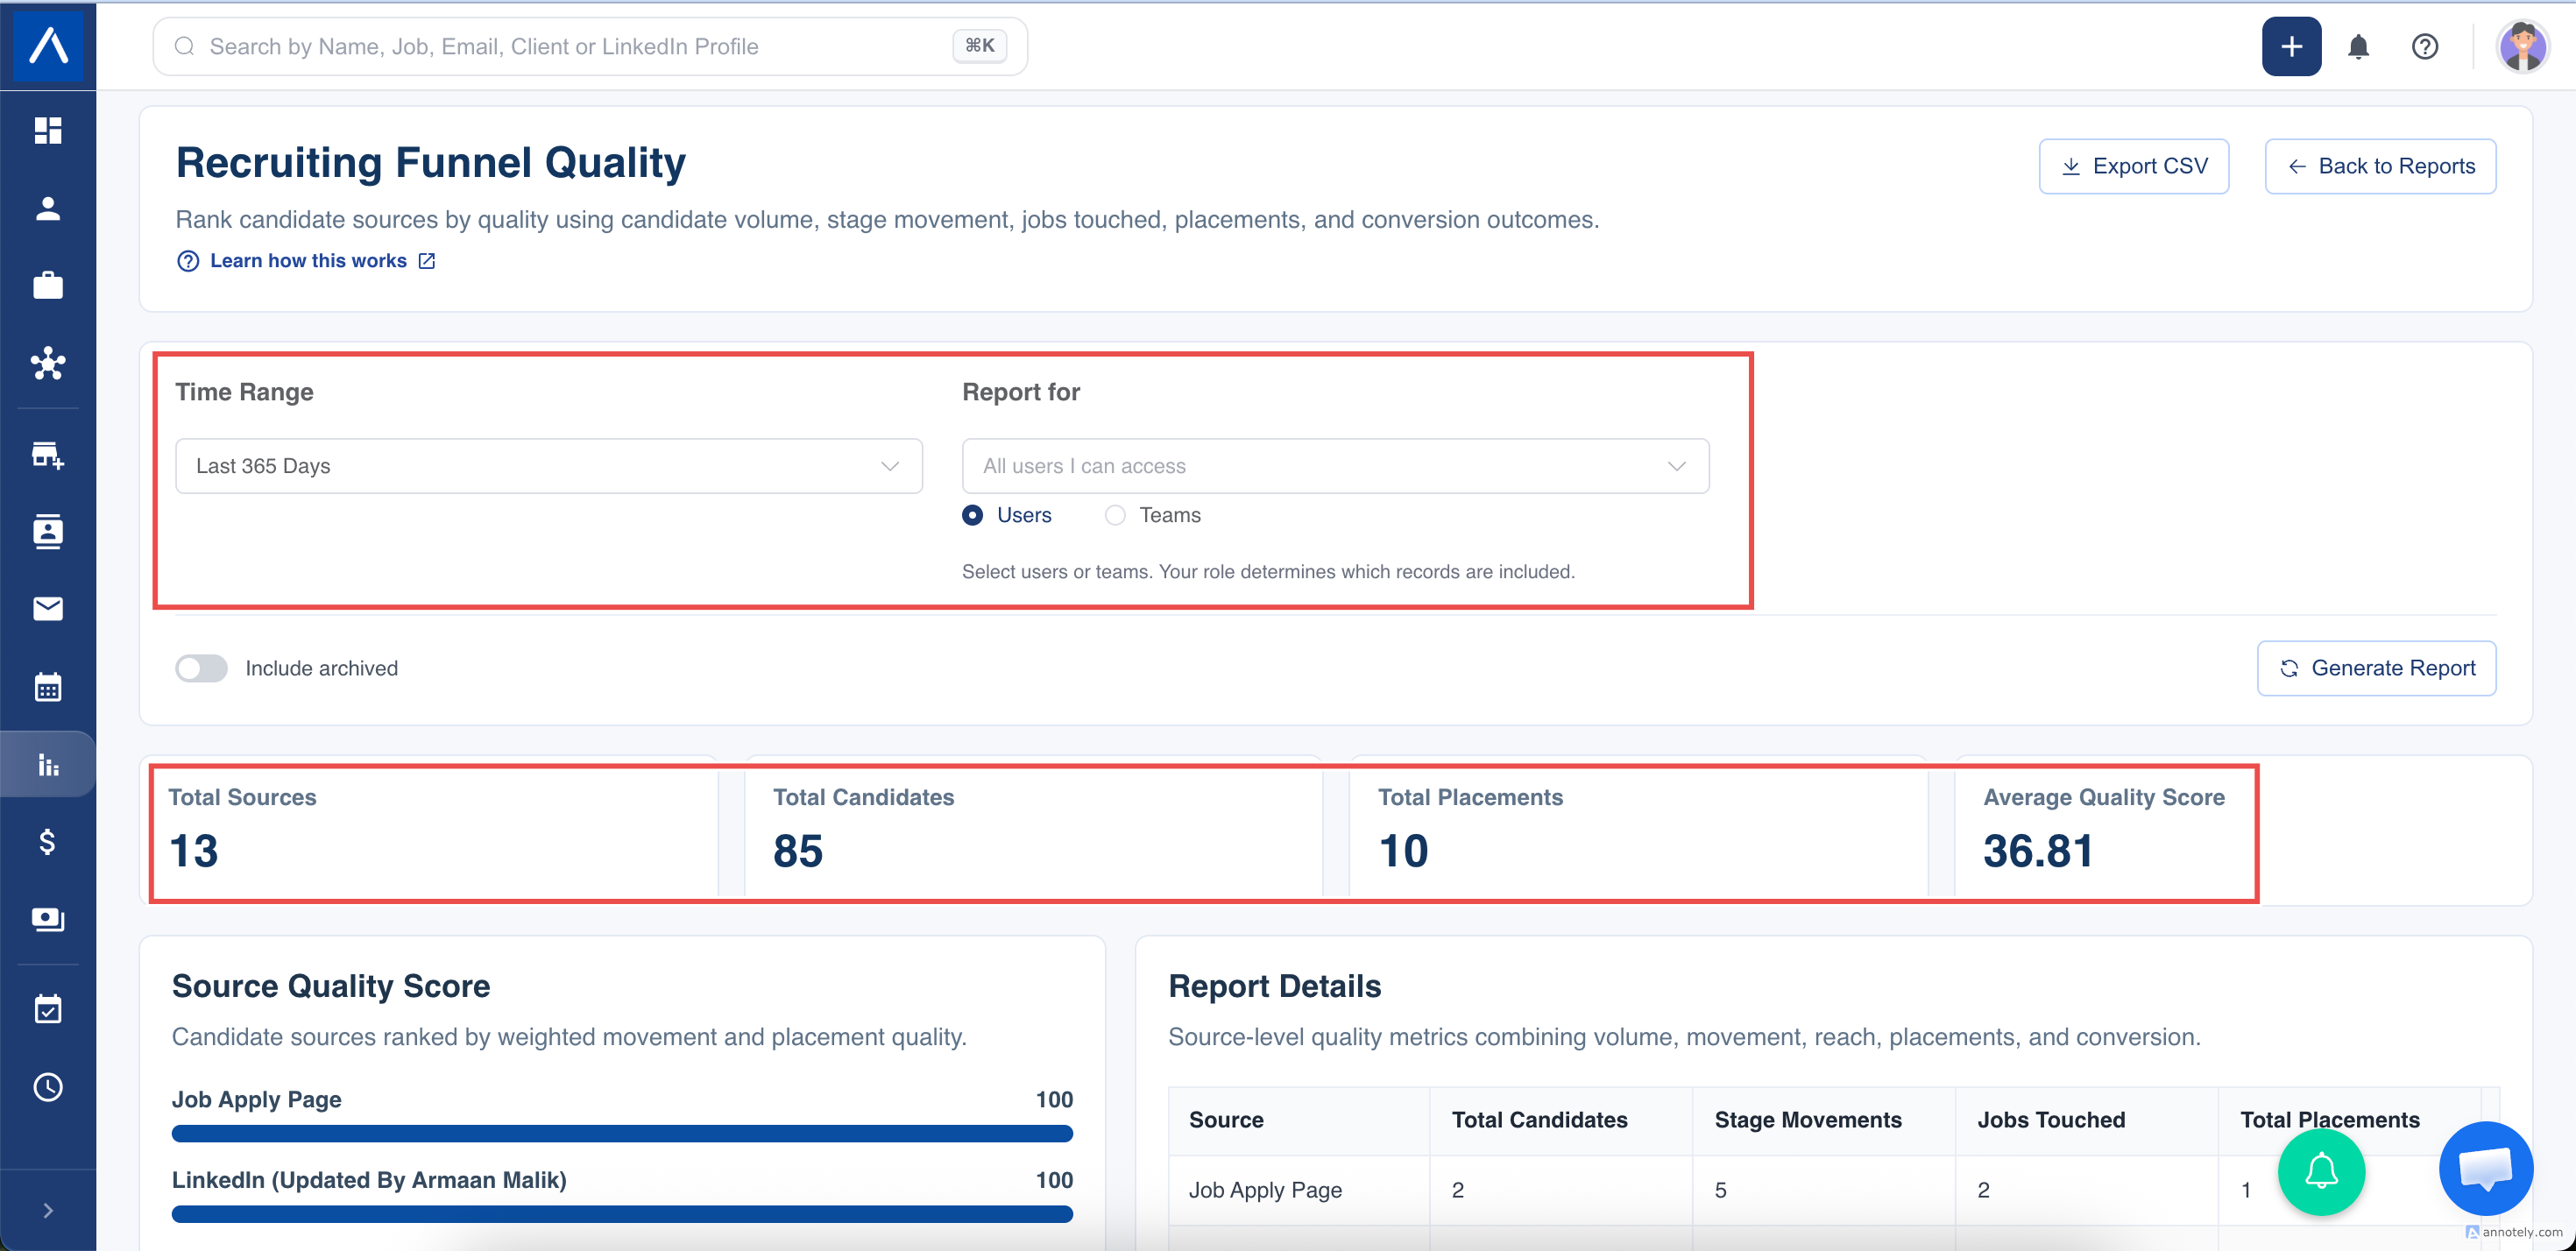
- Choose the date range.
- Apply a recruiter or team filter if required.
- Choose whether archived candidates and jobs should be included.
- Select Generate Report.
Read the Source Rows
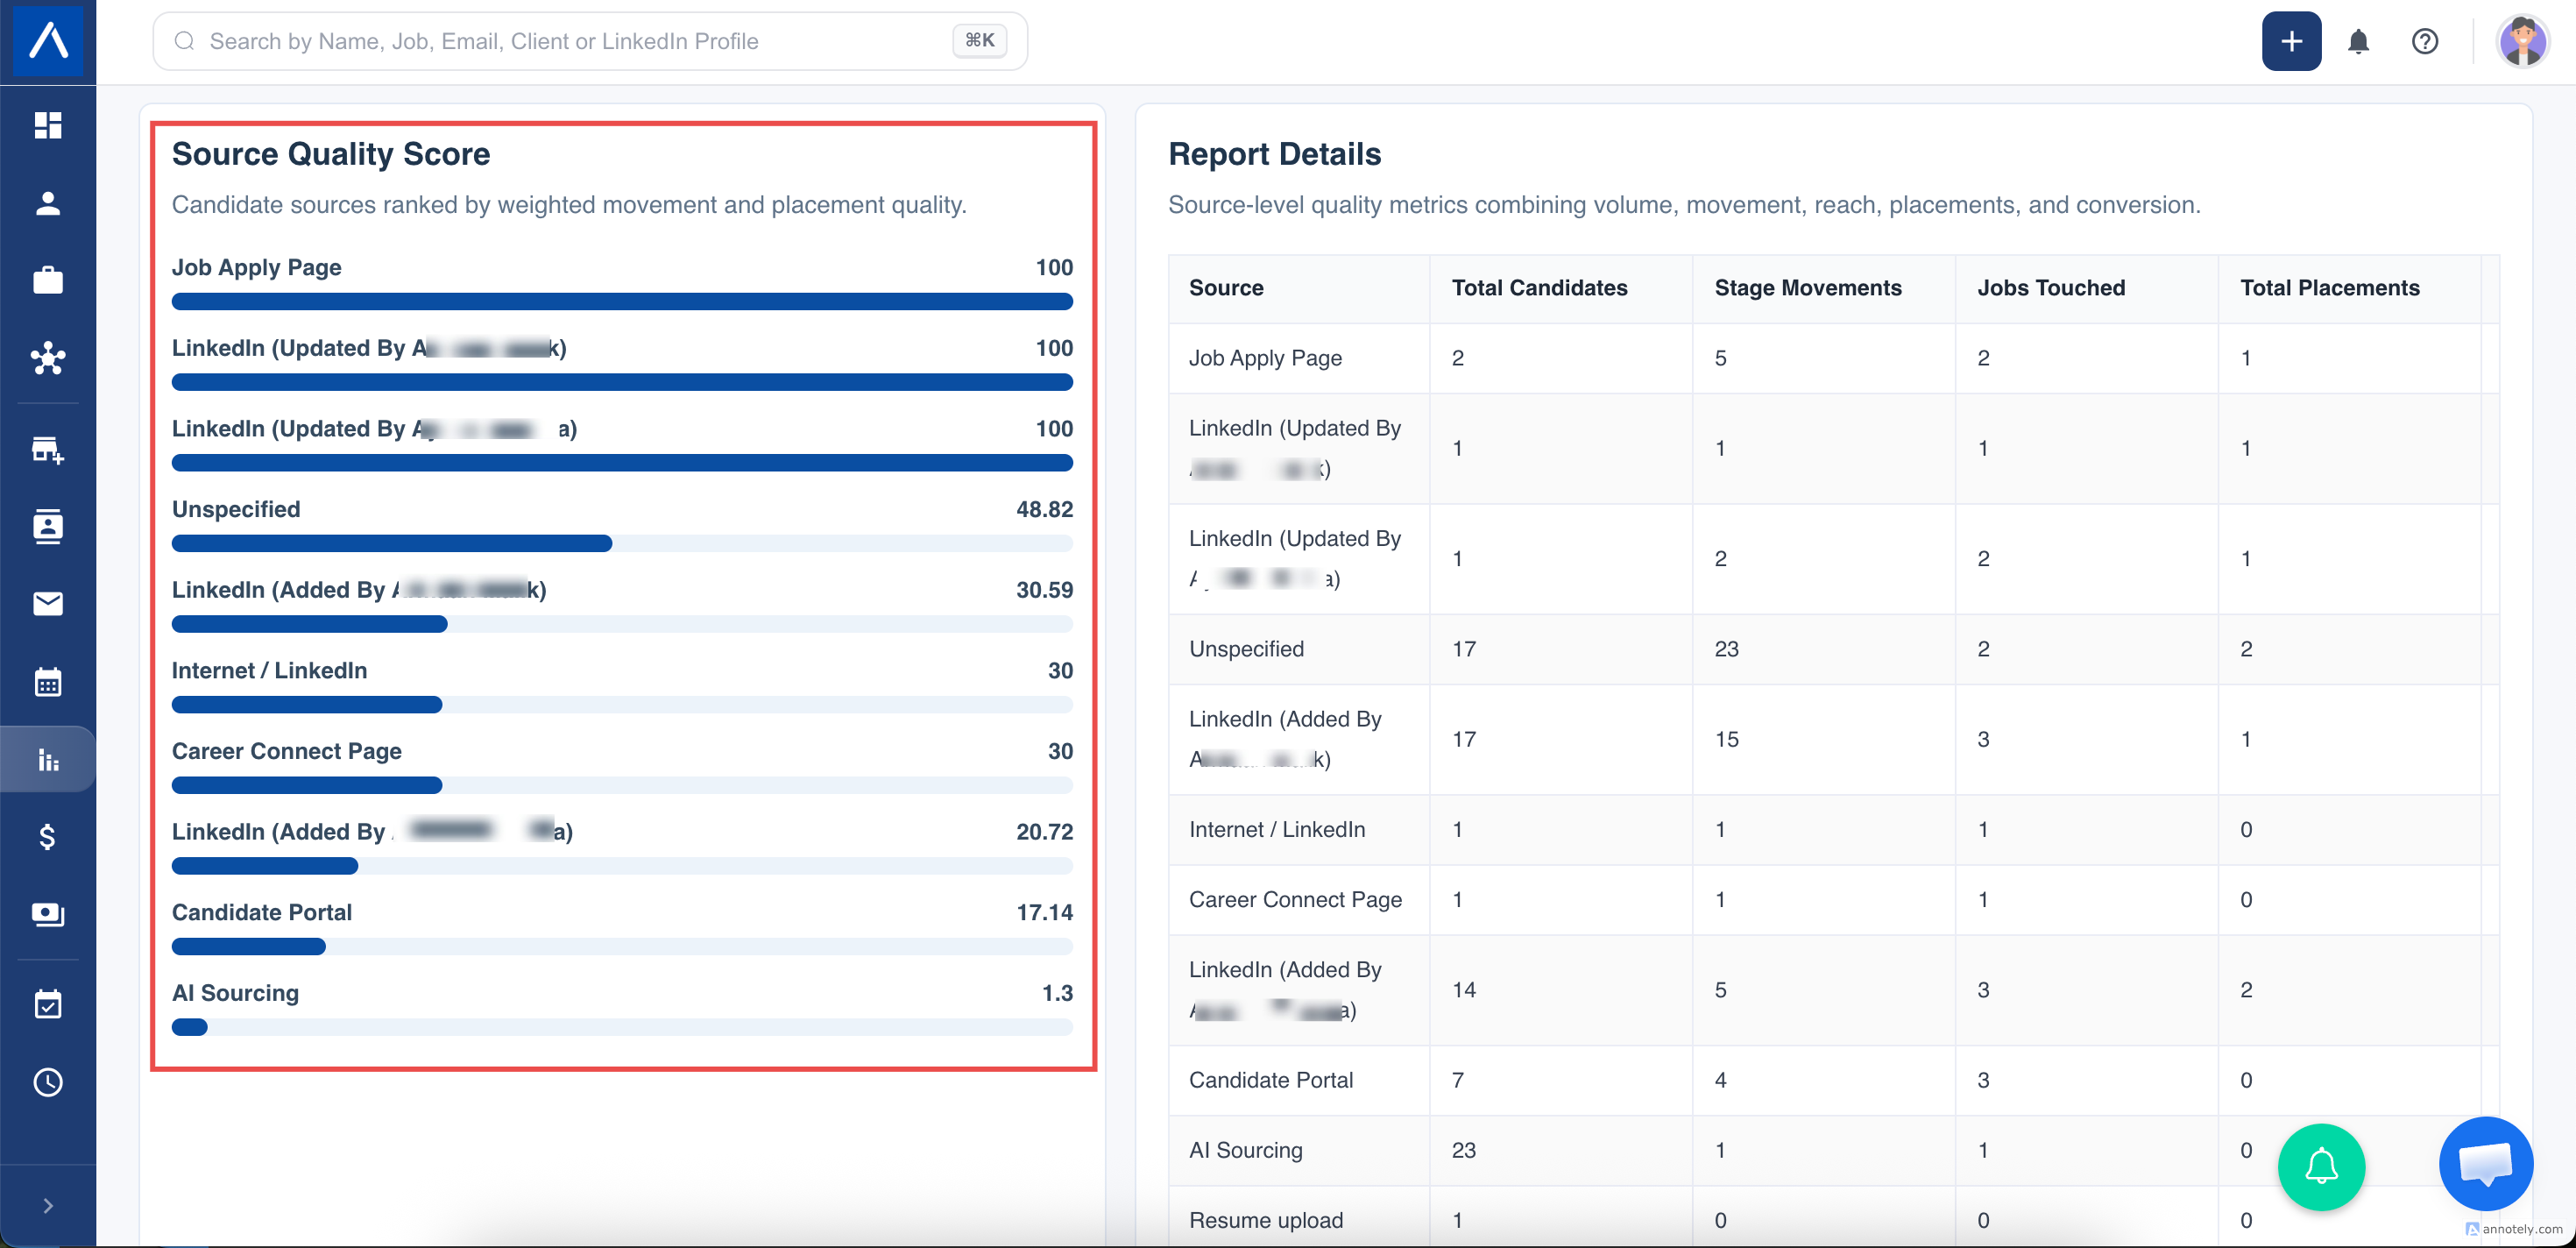
Each source can show:
- Candidates created during the selected period.
- Recorded stage movements during the period.
- Distinct jobs reached through those movements.
- Distinct candidate-and-job applications that entered a stage mapped as Hired.
- Placement rate and movement rate.
- A source quality score.
Candidates without a source value appear under Unspecified so missing attribution remains visible.
Understand the Quality Score
ATZ CRM calculates the source quality indicator from:
- 70% placement rate
- 30% movement rate
The displayed score is capped at 100. The report ranks sources by this score, while the average quality card is the simple average of the displayed source scores rather than an average weighted by candidate volume.
Use the score to identify sources worth investigating. It is not a judgement of candidate suitability and does not account for cost, time spent sourcing, job difficulty, or data entered outside ATZ CRM.
Why Rates May Exceed 100%
Candidate volume is based on records created during the selected period. Stage movements and Hired-stage entries are based on events recorded during that period and can belong to candidates created earlier.
This means a source can record more movements than newly created candidates. The underlying movement or placement rates can therefore exceed 100%, although the final quality score is capped at 100.
Compare Sources Fairly
Use the same date, people, and archive settings when comparing this report with Candidate Source Performance. Also check whether your team records candidate sources and pipeline movements consistently; missing source values and delayed stage updates directly affect the result.
For a practical review, compare quality score with total candidate volume. A very high score based on a small number of candidates deserves different interpretation from the same score across a large, consistent source.
FAQs
How is the quality score calculated?
It combines placement rate at 70% and movement rate at 30%, capped at 100.
Does it rate individual candidates?
No. It is a source-level indicator based on recorded recruitment outcomes.
Why can the source order differ from Candidate Source Performance?
Candidate Source Performance prioritizes volume, while Recruiting Funnel Quality ranks the calculated score.