Team Productivity Insights helps managers compare recruiter performance and evaluate whether team activity aligns with operational goals.
Quick Answer
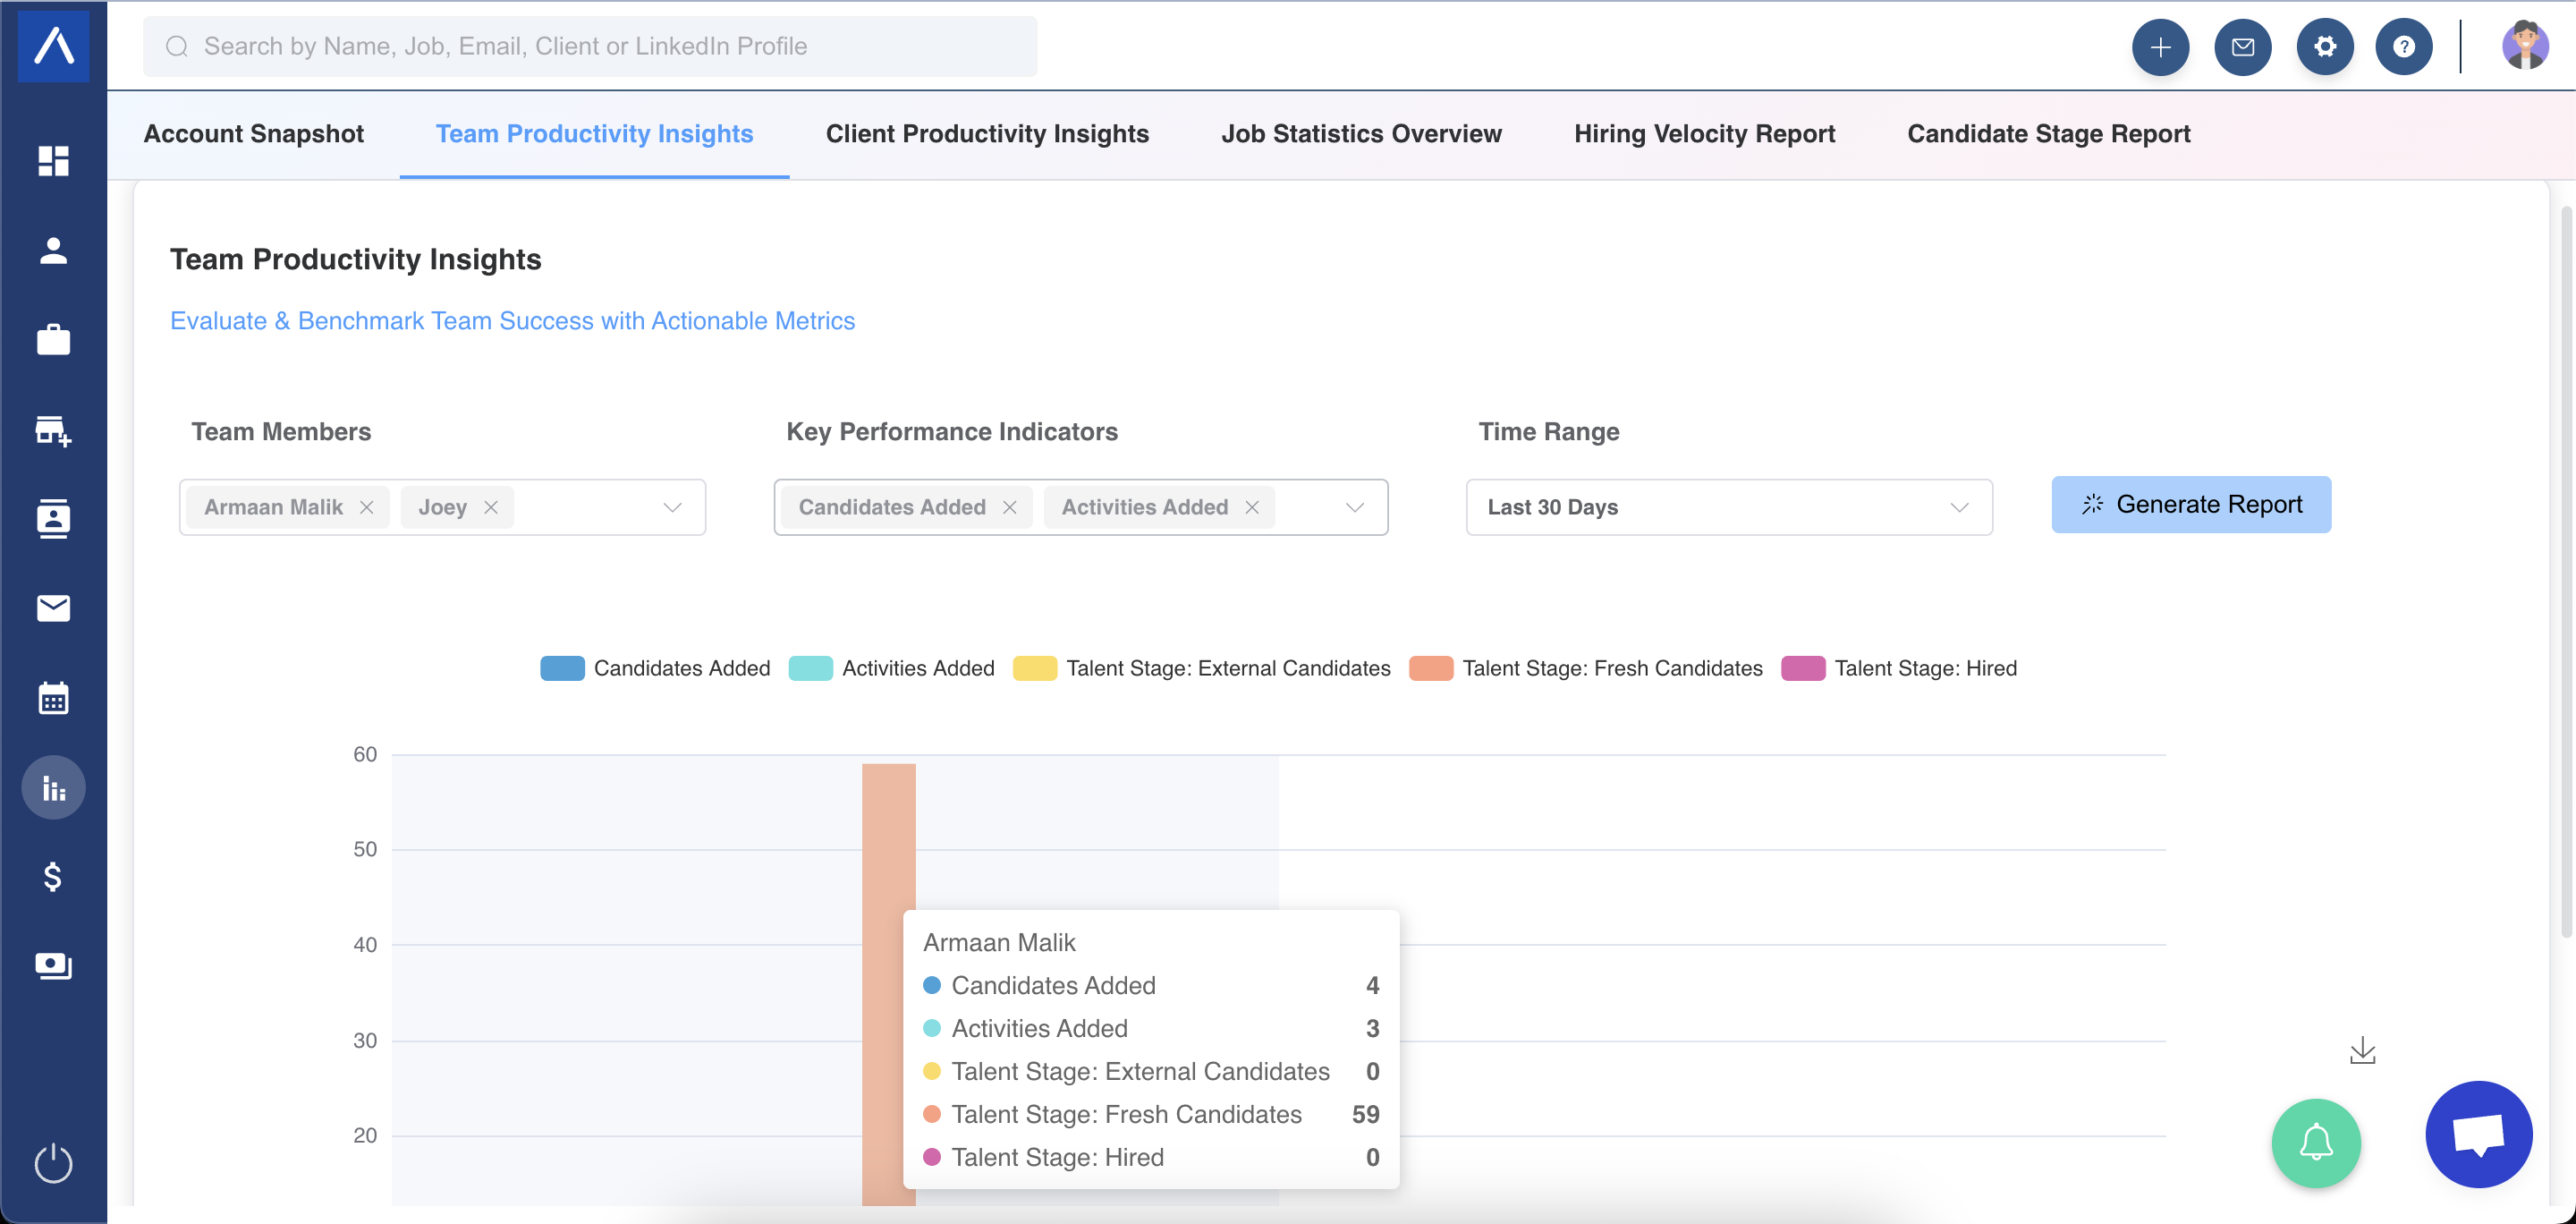
Select recruiters, choose KPIs, set a time range, and generate the report. Use the charts to compare recruiter activity and outcomes.
When to Use This Report
Use Team Productivity Insights when you need to review:
- Recruiter activity.
- Candidate movement through hiring stages.
- Notes and activity records attributed to a recruiter. A logged activity is not necessarily a completed activity.
- Candidate pitching activity.
- Records added by team members.
- Revenue and payment outcomes connected to recruiter activity.
Generate the Report
- Open Team Productivity Insights.
- Select recruiters from the user dropdown.
- Choose KPIs from the KPI selection menu.
- Pick a time range or custom date range.
- Generate the report.
Available KPIs
You can report on:
- Stages in the primary recruitment workflow.
- Notes linked to a recruiter.
- Activities linked to a recruiter.
- Candidate stages in the Candidates Pitched pipeline.
- Entity records added.
- Revenue generated from client-related deals.
- Payments received from client-related deals.
Understand Historical Stage Data
Hiring-stage metrics are historical for the selected time range. A candidate may have reached a stage during that period even if they are now in another stage.
Choose Between Recruiter Comparisons and Team Targets
This report compares the recruiters you select. A saved Team is a membership group managed in Admin Settings, not just a temporary user selection in this report.
Use Goals and Target Reports when you want a recurring target for a team or user. Use Recruitment Activity Trend when you want to compare additions over time.
For saved-team historical reporting, membership dates matter. Current permissions still control which results a user may open. Joining a team does not grant permission to every individual-performance report.
Use Cases
Recruiter Performance Reviews
Compare recruiter productivity during weekly, monthly, or quarterly reviews.
Activity Coaching
Identify recruiters with strong outcomes but low activity, or high activity with low conversion.
Revenue Attribution Review
Review revenue and payment-related KPIs connected to recruiter work.
Troubleshooting
Numbers Do Not Match the Dashboard
Compare the exact KPI, dates, team or recruiter selection, and archive settings. Dashboard widgets may show current state, while report stage metrics show historical movement during the selected range. Matching expanded report and widget measures share definitions, but similarly named legacy metrics can describe a different event.
Recruiter Is Missing
Check user selection, role access, and whether the recruiter has activity during the selected time range.
KPIs Look Empty
Confirm the selected KPIs exist for the chosen users and date range.
FAQs
What does Team Productivity Insights measure?
It measures recruiter performance across selected KPIs such as hiring stages, notes, activities, pitched candidates, records added, revenue, and payments.
Can I use a custom date range?
Yes. You can pick a preset time range or set a custom range.
Are hiring-stage metrics historical?
Yes. Candidates may have been in the reported stage during the selected date range even if their current stage has changed.
Can I compare all recruiters?
Yes. Select the recruiters you want to compare from the user dropdown.
Does the report show bar charts?
Yes. Selected data appears in interactive bar charts.
Can I use this for team planning?
Yes. Use it to spot workload gaps, coaching opportunities, and high-performing workflows.